IT Service Management (ITSM)
Bridge the gap between IT and end-users with an uncomplicated, ITIL-aligned software.

Self-Service Portal
The Self-Service Portal serves as the single point of contact for your end-users. It provides an intuitive way to access information, search the knowledge base, request services from the catalog, or contact IT support. Fully customizable, the portal can be tailored to match your users’ profiles and needs.
Service Catalog
Deliver an exceptional user experience with an intuitive, shopping-style Service Catalog. Empower end-users to easily find and request the services they need. Simplify and automate request fulfillment with predefined templates for faster delivery.
Incident management
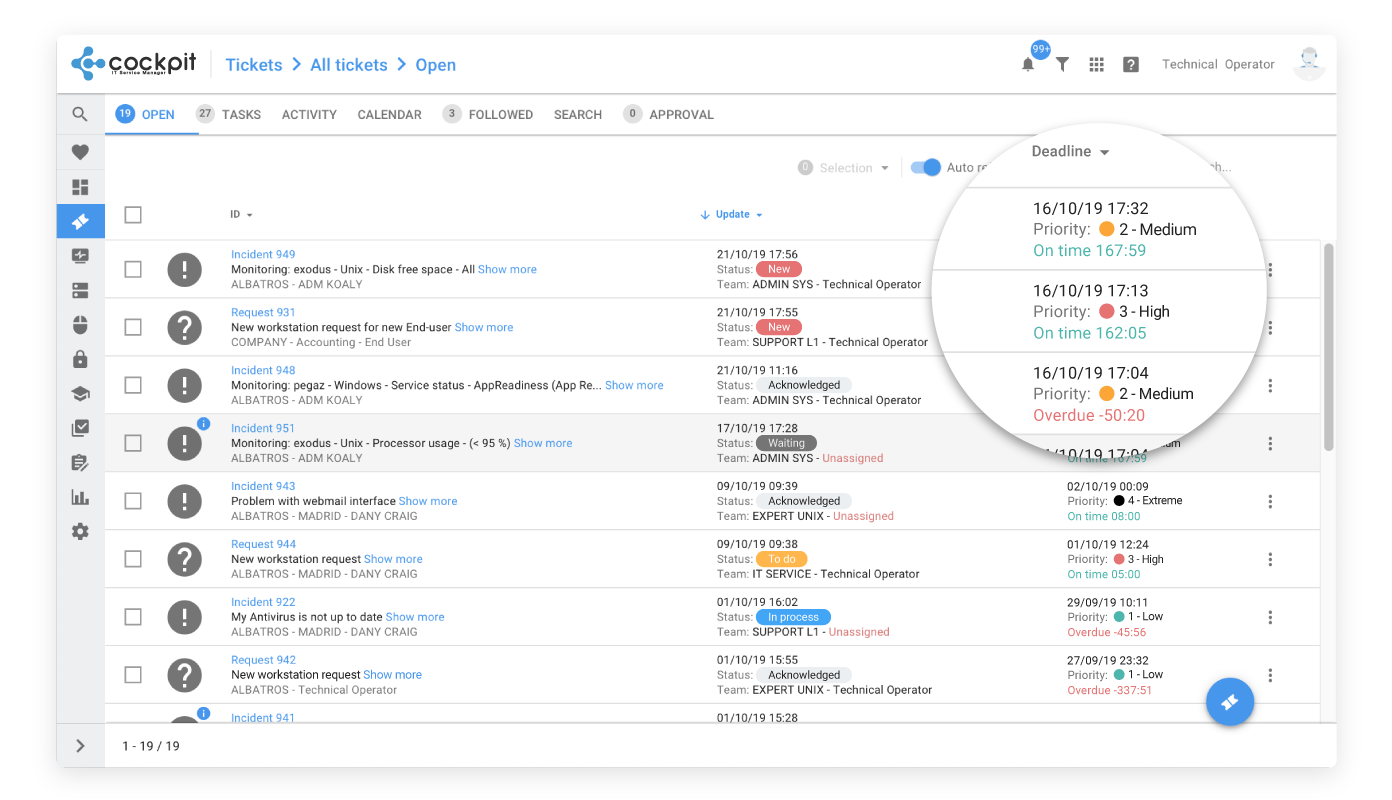
Efficiently log, prioritize, and resolve issues that impact your end-users and business services. Accelerate resolution times and automate incident tracking with seamless ITOM integration.
Problem management
Identify and manage underlying issues efficiently. Link problems to related incidents, diagnose root causes, and document symptoms and impacts. Create and implement procedures with effective workarounds and permanent solutions.
Change management
Evaluate the risk and impact of every change. Streamline the approval process with the Change Advisory Board (CAB) and maintain full visibility by linking changes to other modules, including CMDB, Incidents, Problems, and Releases.
Knowledge management
Empower your end-users with a comprehensive Knowledge Base featuring tips, guides, and step-by-step solutions. By sharing relevant knowledge, users can resolve issues independently — reducing incident requests and freeing up valuable technician time.
SLA management
Define and manage SLA policies based on business hours, acknowledgment times, and resolution deadlines. Link SLAs to templates, priorities, or CMDB assets to ensure consistent service delivery. Configure escalation rules to automatically notify users of SLA breaches.
Approval process
Design flexible, multilevel approval workflows with customizable groups for managers, technicians, and end-users. Streamline approvals for Changes and Requests while automatically notifying the Change Advisory Board (CAB). Enable users to approve or reject tickets directly from the portal or mobile app for faster decision-making.
Workflow automation
Simplify operations with an intuitive drag-and-drop interface to build automation rules with multiple conditions and actions. Automate multilevel approval workflows for Requests and Changes, assign tickets automatically to the right teams, and streamline even the most complex processes.
Satisfaction survey
Monitor service quality with customer satisfaction surveys that measure performance at the ticket level. With a simplified and user-friendly format, end-users can quickly provide feedback on their experience, resulting in a consistently high response rate and valuable insights into overall IT performance.
IT Asset Management (ITAM)
A complete view of your on-premise and cloud infrastructure.

CMDB - Infrastructure
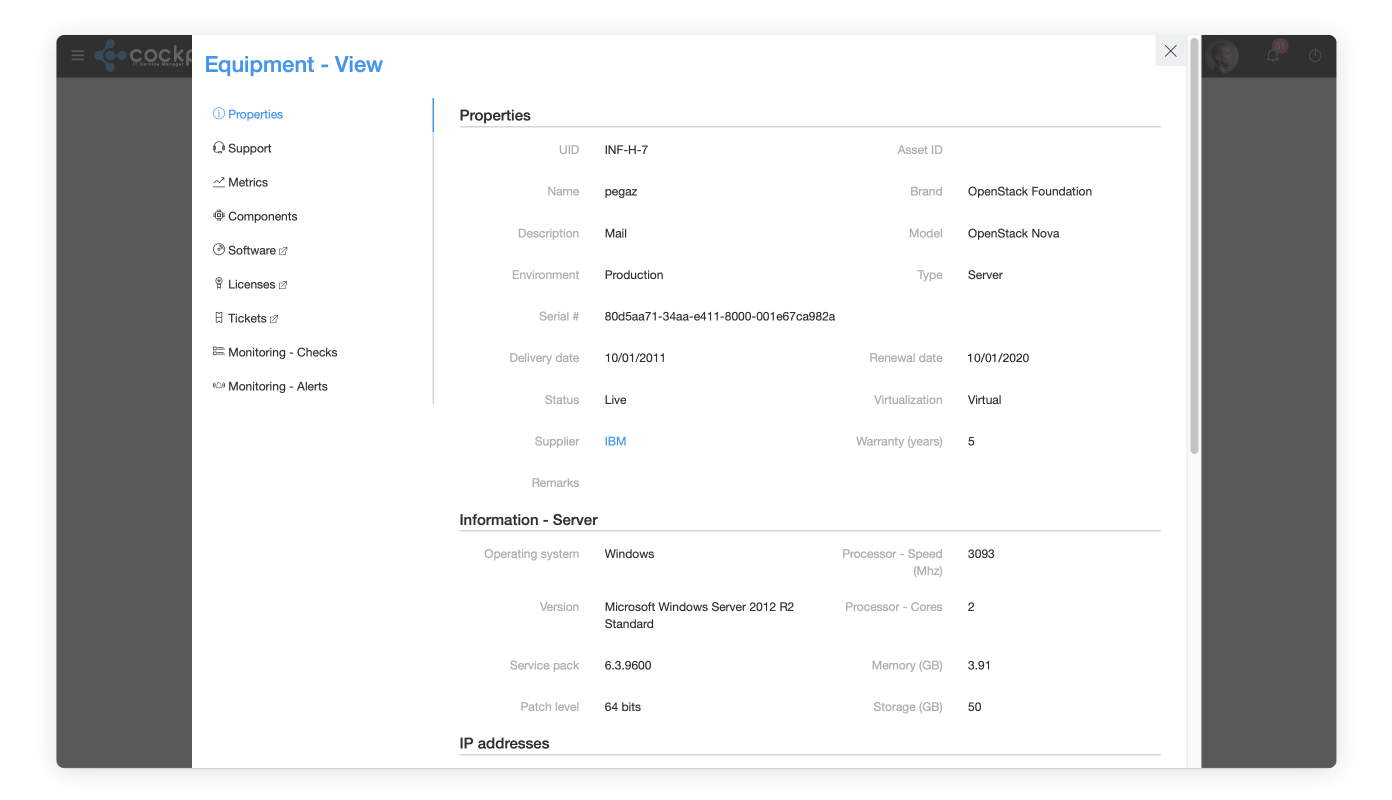
Streamline operations with a centralized CMDB that connects all assets. Maintain a comprehensive repository of infrastructure components across your organization, identify critical assets, minimize risks, and analyze the impact of Incidents, Problems, and Changes.
CMDB - Office
Track and manage your end-user hardware and software assets in one place. Optimize asset usage, track prohibited software, and ensure license compliance. Map each asset with an end-user. Mark all your assets with QR code labels and scan them from the mobile app.
Automated inventory
Keep your asset information always up to date with automated inventory management. The Cockpit ITSM – Satellite remotely collects server component data without requiring agents, while a lightweight agent continuously gathers details from workstations and laptops — wherever they are located.
Software management
Gain complete visibility over your software assets with a unified list view showing installation counts, license details, and manufacturer support information. Classify software as managed, prohibited, or other categories to streamline tracking, compliance, and lifecycle management.
License management
Assign license models — such as unlimited, per user, or per installation — to all managed software. Stay compliant and minimize risks by tracking license expiration dates, and configure alerts to receive advance notifications before licenses expire.
Supplier management
Centralize and manage all information related to your internal and external suppliers, as well as business partners. Document each supplier’s contracts and service agreements, and monitor compliance with these commitments using the ticket OLA functionality.
Contract management
Link each contract to its supplier and to multiple hardware or software assets. Capture key details—hotline numbers, support hours, service levels, and more—and attach digital copies for quick reference. Configure alerts to receive advance notifications before any contract expires.
IT Operations Management (ITOM)
A sentinel to watch over your technology landscape

Alert management
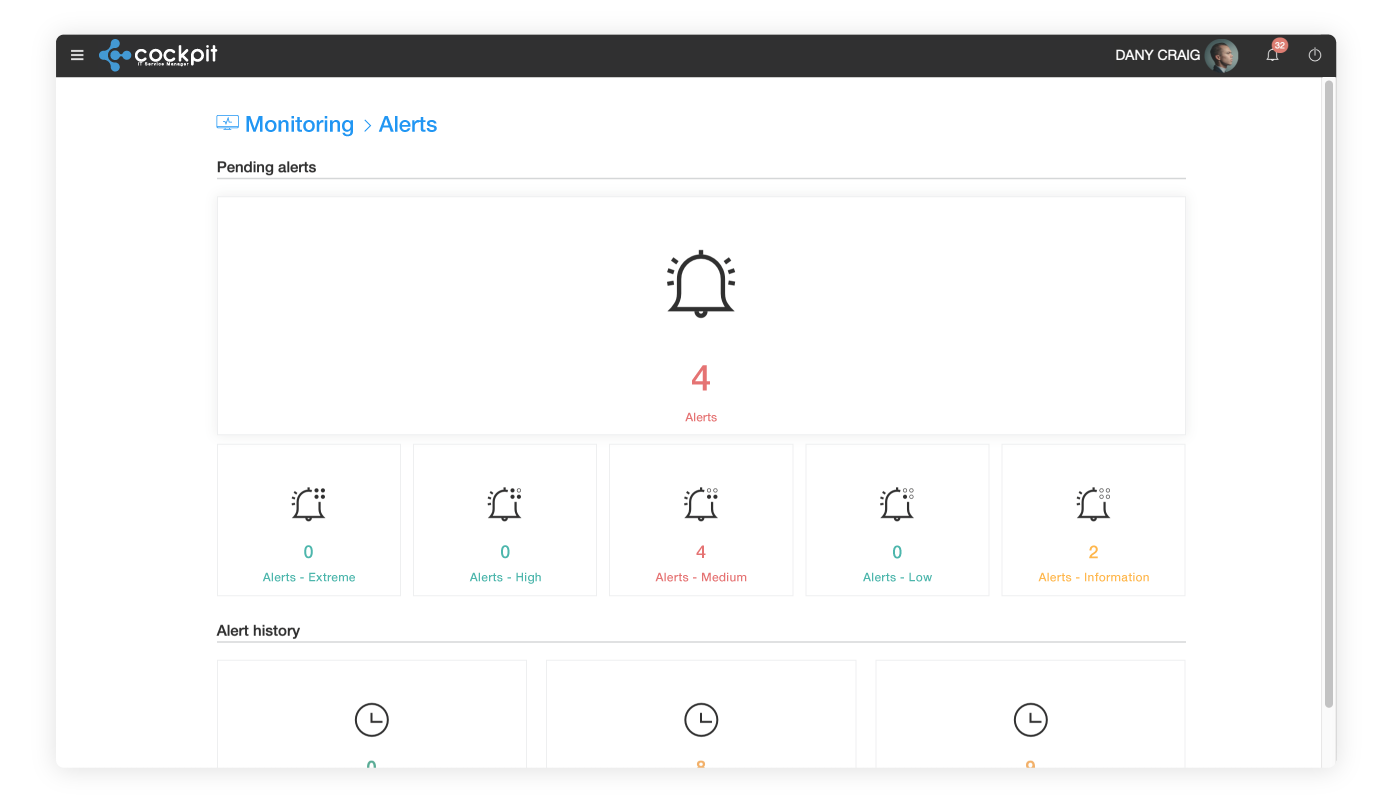
Centralize and manage alerts from multiple sources within a single view. Automatically generate tickets and trigger predefined workflows to accelerate incident response and ensure timely resolution.
Service status
Communicate service availability in real time with a branded status page. Share uptime history, planned maintenance, and incident updates to promote transparency and trust. Proactively notify users to prevent ticket surges during outages and demonstrate operational reliability.
Metrics
Gain full visibility into the performance and capacity of your networks, servers, databases, and applications. Instantly visualize key metrics through dynamic graphs, and retain up to 12 months of data to analyze capacity trends and forecast future needs with daily, monthly, and yearly views.
Integrations
Seamlessly integrate with leading monitoring tools such as Zabbix, Nagios, and Prometheus to ensure timely alerts on the health of your infrastructure, services, and applications. Empower your teams to take action before outages impact your business or end-users. Incoming alerts are automatically consolidated into aggregated alert records for faster triage and resolution.
Built-in monitoring
Cockpit ITSM integrates its own native monitoring engine, enabling comprehensive monitoring of servers, networks, databases, SAP solutions, and cloud environments. The Cockpit ITSM – Satellite continuously collects and analyzes performance metrics to ensure operational continuity and proactive incident detection.
Maintenance windows
Easily manage planned downtime by scheduling maintenance windows for your servers and applications. Simply define the start and end times, and the monitoring process will automatically pause checks and alerts during the maintenance period, then resume once it’s complete — ensuring accuracy without unnecessary notifications.
Notifications
Configure multi-channel notifications via email, SMS, or mobile to ensure rapid awareness of system alerts. Automate incident creation in the ticketing module and apply rule-based templates to trigger alerts based on thresholds, event frequency, or correlation logic.
Complementary Features
A set of tools that help your IT team work smarter, deliver better service, and improve efficiency.

Digital vault
Securely manage all passwords and sensitive information in a centralized digital vault protected by 256-bit AES encryption. Link credentials directly to servers and applications within your infrastructure, and enable technicians to connect seamlessly from the portal through Cockpit ITSM Desktop — without the need to manually enter passwords.
Document management
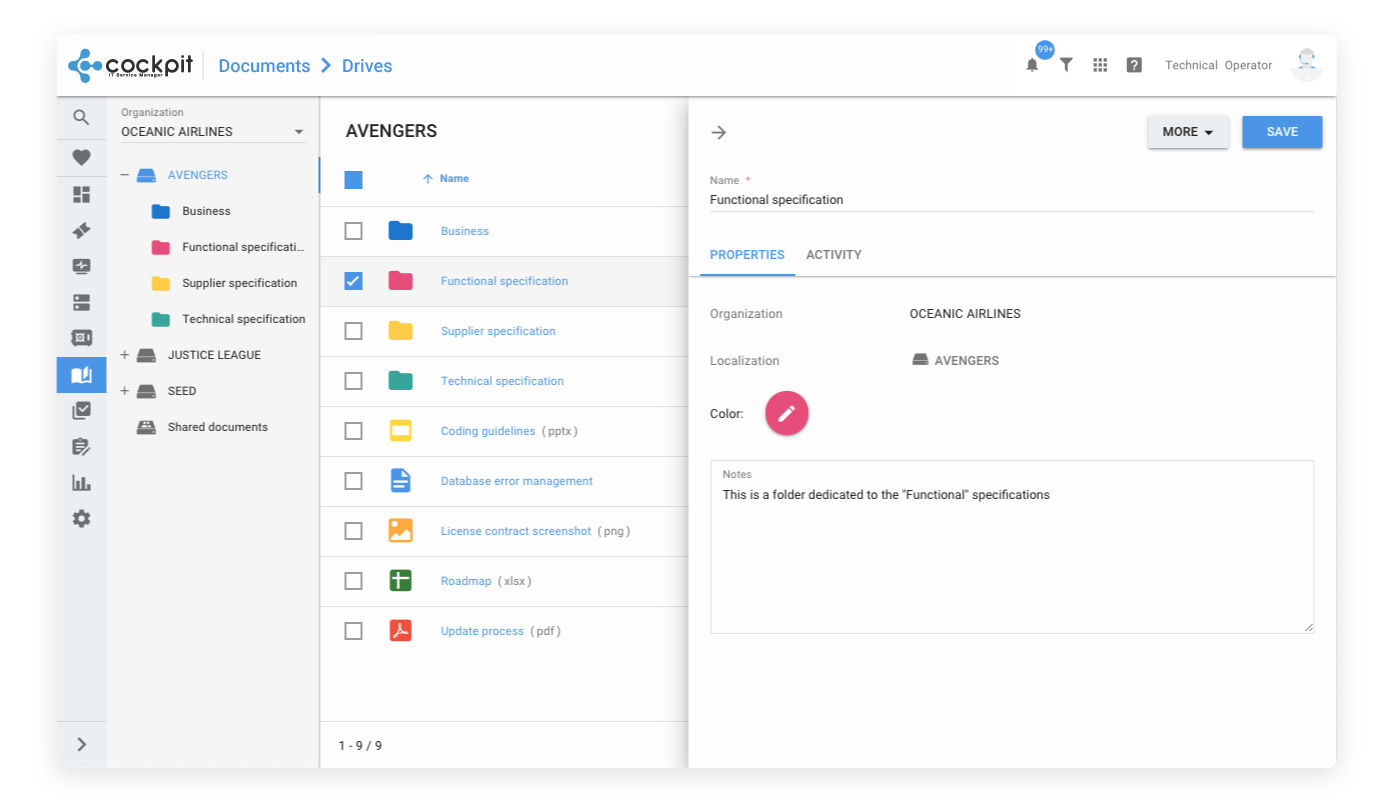
Securely store, organize, and manage all your electronic documents within protected drives. Control file versioning, restoration, and updates while maintaining full visibility through activity tracking and access auditing. Facilitate collaboration and ensure safe, compliant content sharing across your organization.
Task scheduler
Plan and automate recurring activities with task scheduling. Schedule hourly, daily, weekly, monthly, or yearly tasks and automatically populate pending task lists for your teams. Ensure timely completion, monitor workload trends, and analyze performance through detailed reporting and activity insights.
Time tracking
Empower the technicians to track and fill the time spent on tickets, projects and recurring tasks. They can use the built-in timer to enter time automatically. Get reports and analyze workload by ticket, project and recurring tasks.
Communication
Share key updates, announcements, and alerts directly through the Communication Module. Publish important information such as maintenance notices, service news, and critical alerts to keep users informed and engaged. Ensure transparent communication between IT teams and end-users across the organization.
Powerful Analytics
Gain deep insights into your IT operations with powerful analytics. Track key performance indicators, visualize trends, and identify opportunities for improvement across incidents, changes, assets, and service delivery. Make data-driven decisions that enhance efficiency and align IT performance with business goals
Consolidated reports
Create and automate daily, weekly, or monthly report templates that consolidate data from across the ITSM platform — including tickets, tasks, monitoring, and more. Reports are generated automatically, providing a comprehensive view of performance, trends, and operational efficiency.